

How a Grain Rally Could Affect Tractor Sales

This content was originally published by [Farm Equipment]([ORIGINAL ARTICLE URL]) on October 6, 2026, in its Used Equipment Remarketing section. It was written by Andy Campbell, Director of Insights at Tractor Zoom.
Corn prices rallied ahead of harvest. If that rally holds through the end of 2026, what does it mean for row-crop tractor sales? In a recent column for Farm Equipment, Tractor Zoom’s Andy Campbell digs into that question. His answer: commodity prices matter, but the supply sitting on dealer lots matters more.
Andy uses corn as his benchmark because it reflects the current market swing and has historically tracked closely with equipment values. He cautions that commodity prices on their own make a poor forecasting tool. The more useful signals come from the underlying dynamics of supply and sales velocity.
Supply is the bigger lever
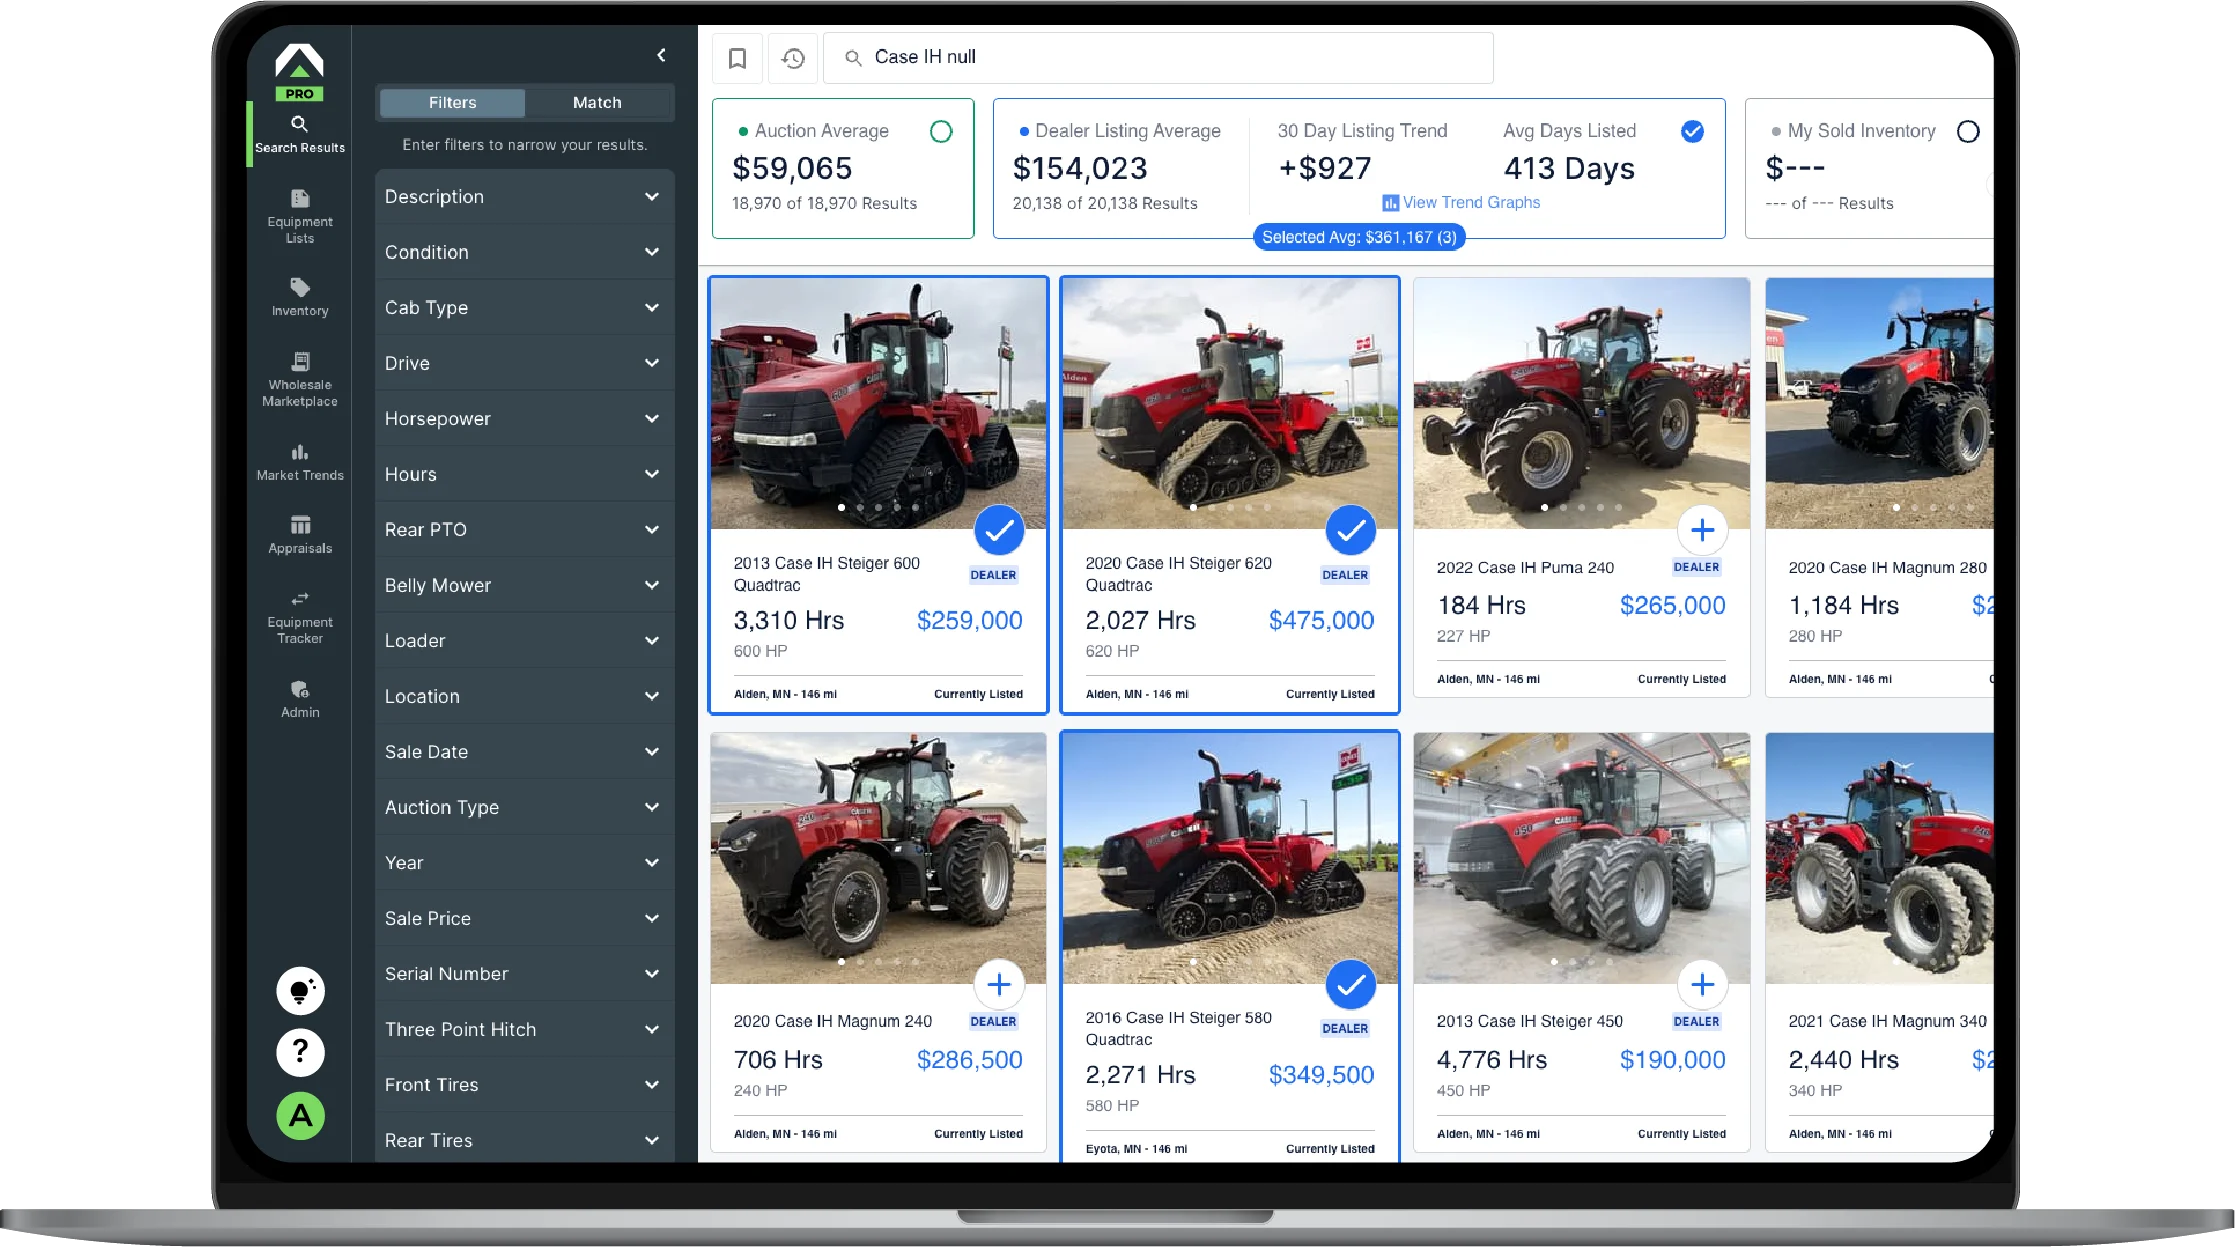
For this analysis, Andy used Tractor Zoom Pro data on used John Deere and Case IH row-crop tractors from 175 to 424 hp sold in the U.S.
Monthly unit sales climbed through 2023. Then demand turned down in 2024, but used inventory kept growing as backlogged OEM production continued to flow into the channel. Supply peaked in the fourth quarter of 2024. Over that stretch, monthly sell-through, meaning the share of listed inventory that sells each month, fell by roughly half, from 20.9% in early 2023 to 10.8% this year. The sharpest drop came in 2024.
Dealers have since worked off about 30% of listed supply. It’s been a game of catch-up, because demand fell faster than supply could adjust. Months-of-supply peaked in early August, and then a strong sales month began turning the tide. That’s the market a grain rally would land in. It also means pent-up replacement demand is quietly building, and it grows every month that new tractor sales stay soft.
What the auction market is saying
Tractor Zoom’s auction value index adjusts for age, hours, and specification. Going back to 2010, it shows auction values moving with corn prices. Auction data is especially useful because an auction price is clean. It has no dealer cost, trade allowance, or floorplan decision baked in, so it reflects what the market will actually pay. Strong auction years have also tended to be strong retail years.

Available supply is the hidden variable in this relationship. When used supply was extremely tight in 2021–2023, auction prices reacted strongly to corn. Values also rose from 2011 to 2013, but less sharply, because supply wasn’t as constrained. Andy notes that today’s market sits between those two: supply is tighter than in 2011 but not as short as in 2022.
The latest correction looks a lot like the last one. The 2012 cycle gave back about 27% of its value. The 2023 cycle gave back about 24% and hit bottom in the second quarter of 2025, nine quarters after its peak. Values have since recovered to about 83% of peak, and roughly 9 points of that recovery came before corn started rallying. In other words, the used market had already turned on its own, driven by lower supply and growing replacement demand.
Dealer retail prices moved the other way during this correction. From 2023 to 2026, they rose about 5% for 175–299 hp tractors and about 10% for 300–424 hp tractors. As a result, the gap between auction and retail prices doubled, from roughly 17% to roughly 34%. That gap is one more cost pressure on farm operations that are already watching inputs closely.
Days on lot: the metric to watch
With most dealers selling through retail whenever possible, Andy recommends days on lot (DoL) as a key benchmark for the used department. Tractor Zoom’s historical analysis shows DoL is tightly correlated with margin (−0.79 on quarterly medians). That means it captures most of what a margin report would tell you, and it updates faster.
Median DoL has climbed from about 70–85 days in late 2022 and early 2023 to about 285 days today, in both horsepower classes. The more revealing view comes from breaking it down by engine hours:
- The slowest-moving tractors are the low-hour units, especially those with 501–1,000 hours. They average 185 days on lot in the 175–299 hp class and 231 days in the 300–424 hp class.
- Tractors with more than 2,000 hours clear in roughly 90–100 days, regardless of horsepower.
- Low-hour units also carry the highest price tags. That means they tie up a disproportionate share of capital, for about twice as long. For larger tractors, the slowest-moving range is 300,000–400,000.
That points to an opportunity for dealers to recover margin on slower-moving, late-model inventory.
Coming back to corn
When Andy compared days on lot with cash corn prices, a pattern emerged. In the last 15 quarters, cash corn topped $5.20 in four of them. Three of those four were the fastest-selling quarters for tractors Tractor Zoom has measured, and the fourth ranked about seventh. Quarters with corn below $4.60 were slower and far less consistent.

Andy calls this a pattern worth watching, not a rule. Break-even prices shift with input costs and vary from farm to farm. He puts his own farm’s break-even near $5.40, while a more established neighbor may break even below $5. At the time of writing, cash corn was running near $5.00 nationally. The nearby futures contract hit a three-year high of $5.21 on September 1, and December futures were trading near $5.48.
Setting up for a December showdown
Rally or no rally, December is typically a big month for tractor sales. Volume for 175–300 hp tractors runs about double a normal month, and larger tractors run about 70% above normal. If corn keeps clearing break-even, Andy expects a stronger-than-usual December run-up. He also expects it to be uneven across regions:
- USDA’s September estimate put the national corn yield at 178.5 bushels per acre, down from 186.5 last year.
- Iowa and Illinois look strongest among the major corn states. Missouri, Tennessee, and Pennsylvania are tracking above trend.
- North Dakota has a 93% probability of finishing below trend yield. South Dakota’s probability is 80%, and North Carolina’s is effectively 100%.
- Record-high diesel prices could nudge buyers toward newer, more fuel-efficient tractors.
The broader backdrop is still challenging. New tractor retail sales are down 38% over two years. The Creighton Farm Equipment Sales Index came in at 22.2 in August, its 36th straight month below growth-neutral. Equipment borrowing accounts for just 5.3% of ag lending, so replacement purchases are more likely to be funded with cash and timed for tax benefits than financed. That makes regional profitability the deciding factor this year.
One encouraging sign: August sales velocity was significantly faster than both the prior month and August of last year. Some of that pace came at the expense of margin, but it also cleared inventory and left supply tighter heading into the final selling months of 2026.
Andy’s advice to dealers is to get ready now. Know the available supply on your lot and in your area, and reprice to hit your margin targets. Then canvass your sales territory and execute your plan, so you’re prepared to evaluate, quote, trade, and invoice when demand arrives. The combination of tighter supply, a pent-up replacement cycle, cash on hand, and a December tax window has produced run-ups before, and it likely will again.
For more on how the grain rally is playing out in the equipment market, see Andy’s comments in Bloomberg’s coverage, A 104-Year-Old Farmer’s $183,000 Tractor Sale Tests a US Farm Recovery. You can also read his earlier analysis, Grain Carts: A Bellwether for What’s Next in the Implement Market.

Join the future of ag & heavy equipment sales
Take a guided tour of Tractor Zoom Pro and Anvil Pro to discover how wider margins and faster turns are just a few clicks away.