

.webp)

Equipment Market Update: May 2026 Trends Across Categories
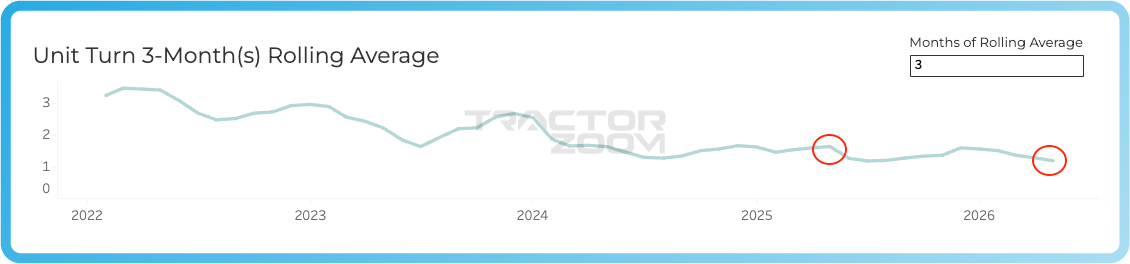
The data from May marks a clear turn from the spring selling season. After planting- and application-window demand propped up used sales through March and April, turn rates rolled over in nearly every category this month, most dramatically in row crop tractors. Inventory continued to contract year over year across the board, with one striking exception: 4WD tractors, where used supply rose considerably.
The throughline for dealers heading into summer is that tighter supply may be helping with lower inventory costs, but pent-up demand is not yet translating into increased sales across the board, and the categories that carried the spring are now cooling. For a more complete breakdown of equipment categories and trends, attend our Q2 Equipment Market Webinar, live on June 24.
Category spotlight: Smaller row crop tractors
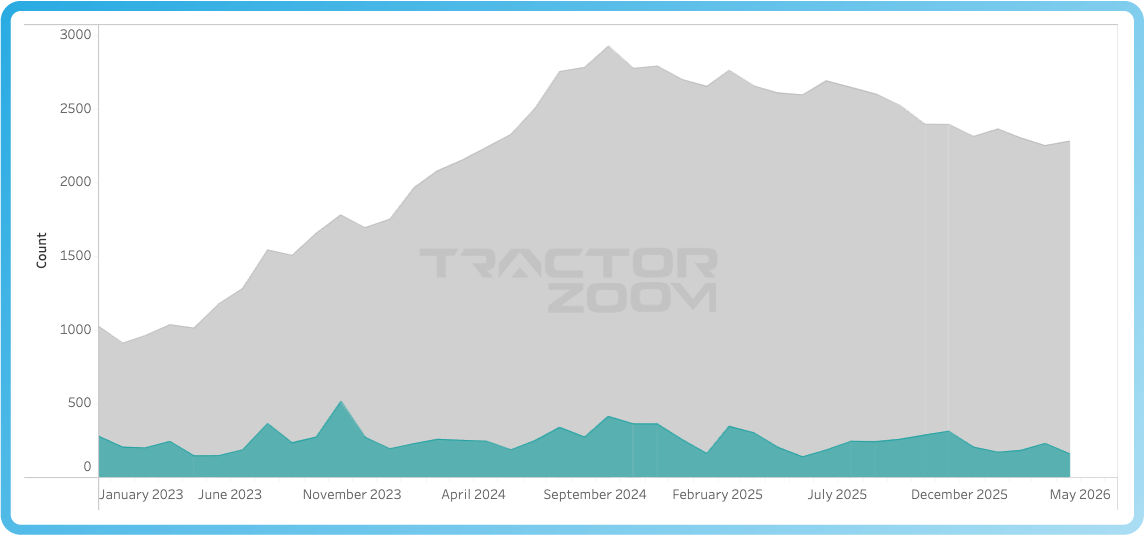
As the industry closes out the first half of 2026, the backdrop is disciplined supply: Total used equipment inventory is down roughly 20% year over year, and OEMs used their latest earnings calls to reinforce that they intend to keep production in check. That restraint is a tailwind. The near-term concern across nearly every category, though, is velocity, or the lack-there-of. Equipment is simply selling slower than a year ago, and tractors are not immune.
A clear signal this month comes from smaller row crop tractors (175–299 HP). Supply is flattening, with May inventory sitting roughly where it did back in December; but velocity has weakened in a specific and telling way. Among low-hour units (under 2,000 hours), the share selling within the first 60 days has dropped from a historical norm near 38% to about 25%, while higher-hour units (2,000–5,000 hours) are holding closer to normal at about 50% that sell in the first two months..
In other words, the pinch is concentrated in late-model, low-hour machines, and it tracks with the commodity stress running through the southern soybean, cotton, and rice regions where these tractors are most heavily used.
Equipment category analysis: Velocity rolls over as the spring window closes
Row crop tractors (300–424 HP)
Row crop tractors were the headline story, and not in a good way. Inventory eased, but the turn rate fell sharply to 1.2, down 25% YoY, the steepest turn drop in the report and a clear sign the spring buying urgency has passed. The same story shows up in sales with units sold within 60 days of listing down striking 63% YoY. Meanwhile, aged inventory in this category held flat.
- Inventory Volume: -3.0% MoM / -14% YoY
- Turn Rate: -27% MoM / -25% YoY
- 60-Day Velocity: -26% MoM / -63% YoY
- Aged Inventory: FLAT MoM / +5.9% YoY
Smaller row crop tractors (175–299 HP)
The smaller row crop segment held up better than its higher-horsepower sibling. Inventory rose 4.1% MoM, but remained down 23% YoY, while the turn rate slipped only modestly to 1.5. Encouragingly, aged inventory fell to just 24% of inventory, down 9.3% MoM and 13% YoY, the second-lowest aged share in the report.
- Inventory Volume: +4.1% MoM / -23% YoY
- Turn Rate: -6.3% MoM / -21% YoY
- 60-Day Velocity: -22% MoM / -19% YoY
- Aged Inventory: -9.3% MoM / -13% YoY
4WD tractors (425+ HP)
4WD tractors are the anomaly of the month. Inventory jumped 26% MoM and is now up 8.5% YoY (the only category carrying a year-over-year increase) likely due to a wave of trade-ins and off-season listings. That supply landed in a soft market. The turn rate held flat at 1.0 MoM but sits 23% below year-ago levels, and fewer units sold within 60 days (-21% MoM, -38% YoY). Aged inventory did decline 3.5% MoM but remains up 26% YoY at 32% of inventory.
Rising supply plus weak velocity makes this the clearest margin risk in the report, so dealers should price incoming big-iron trades aggressively from day one.
- Inventory Volume: +26% MoM / +8.5% YoY
- Turn Rate: FLAT MoM / -23% YoY
- 60-Day Velocity: -21% MoM / -38% YoY
- Aged Inventory: -3.5% MoM / +26% YoY
Utility tractors (100–174 HP)
Utility tractors remain one of the steadier segments. Inventory edged up 2.2% MoM but is down 28% YoY, among the largest YoY inventory contractions in the report. Meanwhile, the turn rate dipped down 22% from May 2025. Sales slowed sharply, with units sold within 60 days down 56% YoY. Aged inventory eased down to 23% of inventory, the lowest aged share of any category.
Diversified demand from livestock, hay, and smaller operations gives this segment a more durable floor than the row-crop and big-iron classes.
- Inventory Volume: +2.2% MoM / -28% YoY
- Turn Rate: -6.7% MoM / -22% YoY
- 60-Day Velocity: -29% MoM / -56% YoY
- Aged Inventory: -2.2% MoM / -18% YoY
Combines (Class 7 & 8): Inventory tightens but velocity stays stuck in low gear
Combines were the quietest category as they sit on-deck in their off-season. Aged inventory fell 4.3% MoM and 8.4% YoY, trimming the stale share down to 32% as we head into the sale heavy months.
- Inventory Volume: -0.6% MoM / -14% YoY
- Turn Rate: FLAT MoM / -13% YoY
- 60-Day Velocity: +8.3% MoM / -32% YoY
- Aged Inventory: -4.3% MoM / -8.4% YoY
Self-propelled sprayers: Herbicide application window closes and the spring standout cools
Sprayers, one of the spring's strongest performers, came off the boil as the herbicide application window narrowed. Inventory fell 5.0% MoM and is down 32.5% YoY, the second-steepest YoY supply contraction in the report. But the turn rate eased only to 1.8 and held flat YoY, still tied for the strongest velocity tracked. This category is still tied for the strongest velocity tracked, and sales did ease, with a decrease in first-60-day sales decreasing 13% MoM 40.9% YoY — but the monthly decline was milder than most categories. Aged inventory dropped 9.0% MoM and 20.0% YoY, though the aged share remains elevated at 34% of a much smaller base.
- Inventory Volume: -5.0% MoM / -33% YoY
- Turn Rate: -5.3% MoM / 0.0% YoY
- 60-Day Velocity: -13% MoM / -41% YoY
- Aged Inventory: -9.0% MoM / -20% YoY

Planters (all rows): Planting season ends and velocity drops off
Planters followed the same seasonal arc as sprayers. Inventory declined 36% YoY, while the turn rate slipped to 1.7 — still healthy but off its spring peak. The velocity pullback was the steepest in the report on a monthly basis, with 60-day-velocity down 61% YoY as the planting window closed. Aged inventory fell slightly, yet the aged share of 36% is the highest among these categories, which is expected based on seasonal demand decline.
- Inventory Volume: -4.4% MoM / -36% YoY
- Turn Rate: -5.6% MoM / -15% YoY
- 60-Day Velocity: -44% MoM / -61% YoY
- Aged Inventory: -4.7% MoM / -26% YoY
Key takeaway for dealers heading into summer
Velocity rolled over almost everywhere, so supply tightness alone won't sell units. Inventory is down year over year in every segment except 4WD tractors, but tighter supply only converts to margin when units actually move. Days-on-lot and repricing discipline matter more now than at any point this spring.
Definitions & data sources
All equipment data and market trends presented in this report are sourced from Tractor Zoom Pro's dealer and auction marketplace database, which tracks equipment listings, transactions, and inventory activity across the U.S.
- Inventory Volume: The total number of equipment units actively listed for sale across the tracked dealer network at the time of reporting.
- Turn Rate: A measure of how quickly inventory is selling, calculated using a three-month rolling average of unit retail sales volume relative to available inventory. Higher turn rates indicate faster inventory movement and stronger market absorption.
- Aged Inventory %: The percentage of active inventory that has been listed for 360 days or longer, indicating the share of inventory experiencing extended selling timelines.
- Reporting period: Data reflects May 2026. MoM comparisons are vs. April 2026; YoY comparisons are vs. May 2025.
Make the market work for you
The market is shifting fast, and the dealers who stay ahead of it are the ones with the right data in hand. Tractor Zoom Pro gives you real-time visibility into inventory trends, pricing benchmarks, and sales velocity across the used equipment market so you can make smarter decisions on what to stock, how to price it, and when to move it.
Explore Tractor Zoom Pro and put your inventory strategy on firmer ground.

Join the future of ag & heavy equipment sales
Take a guided tour of Tractor Zoom Pro and Anvil Pro to discover how wider margins and faster turns are just a few clicks away.