

.webp)

Equipment Market Update: March 2026 Trends Across Categories
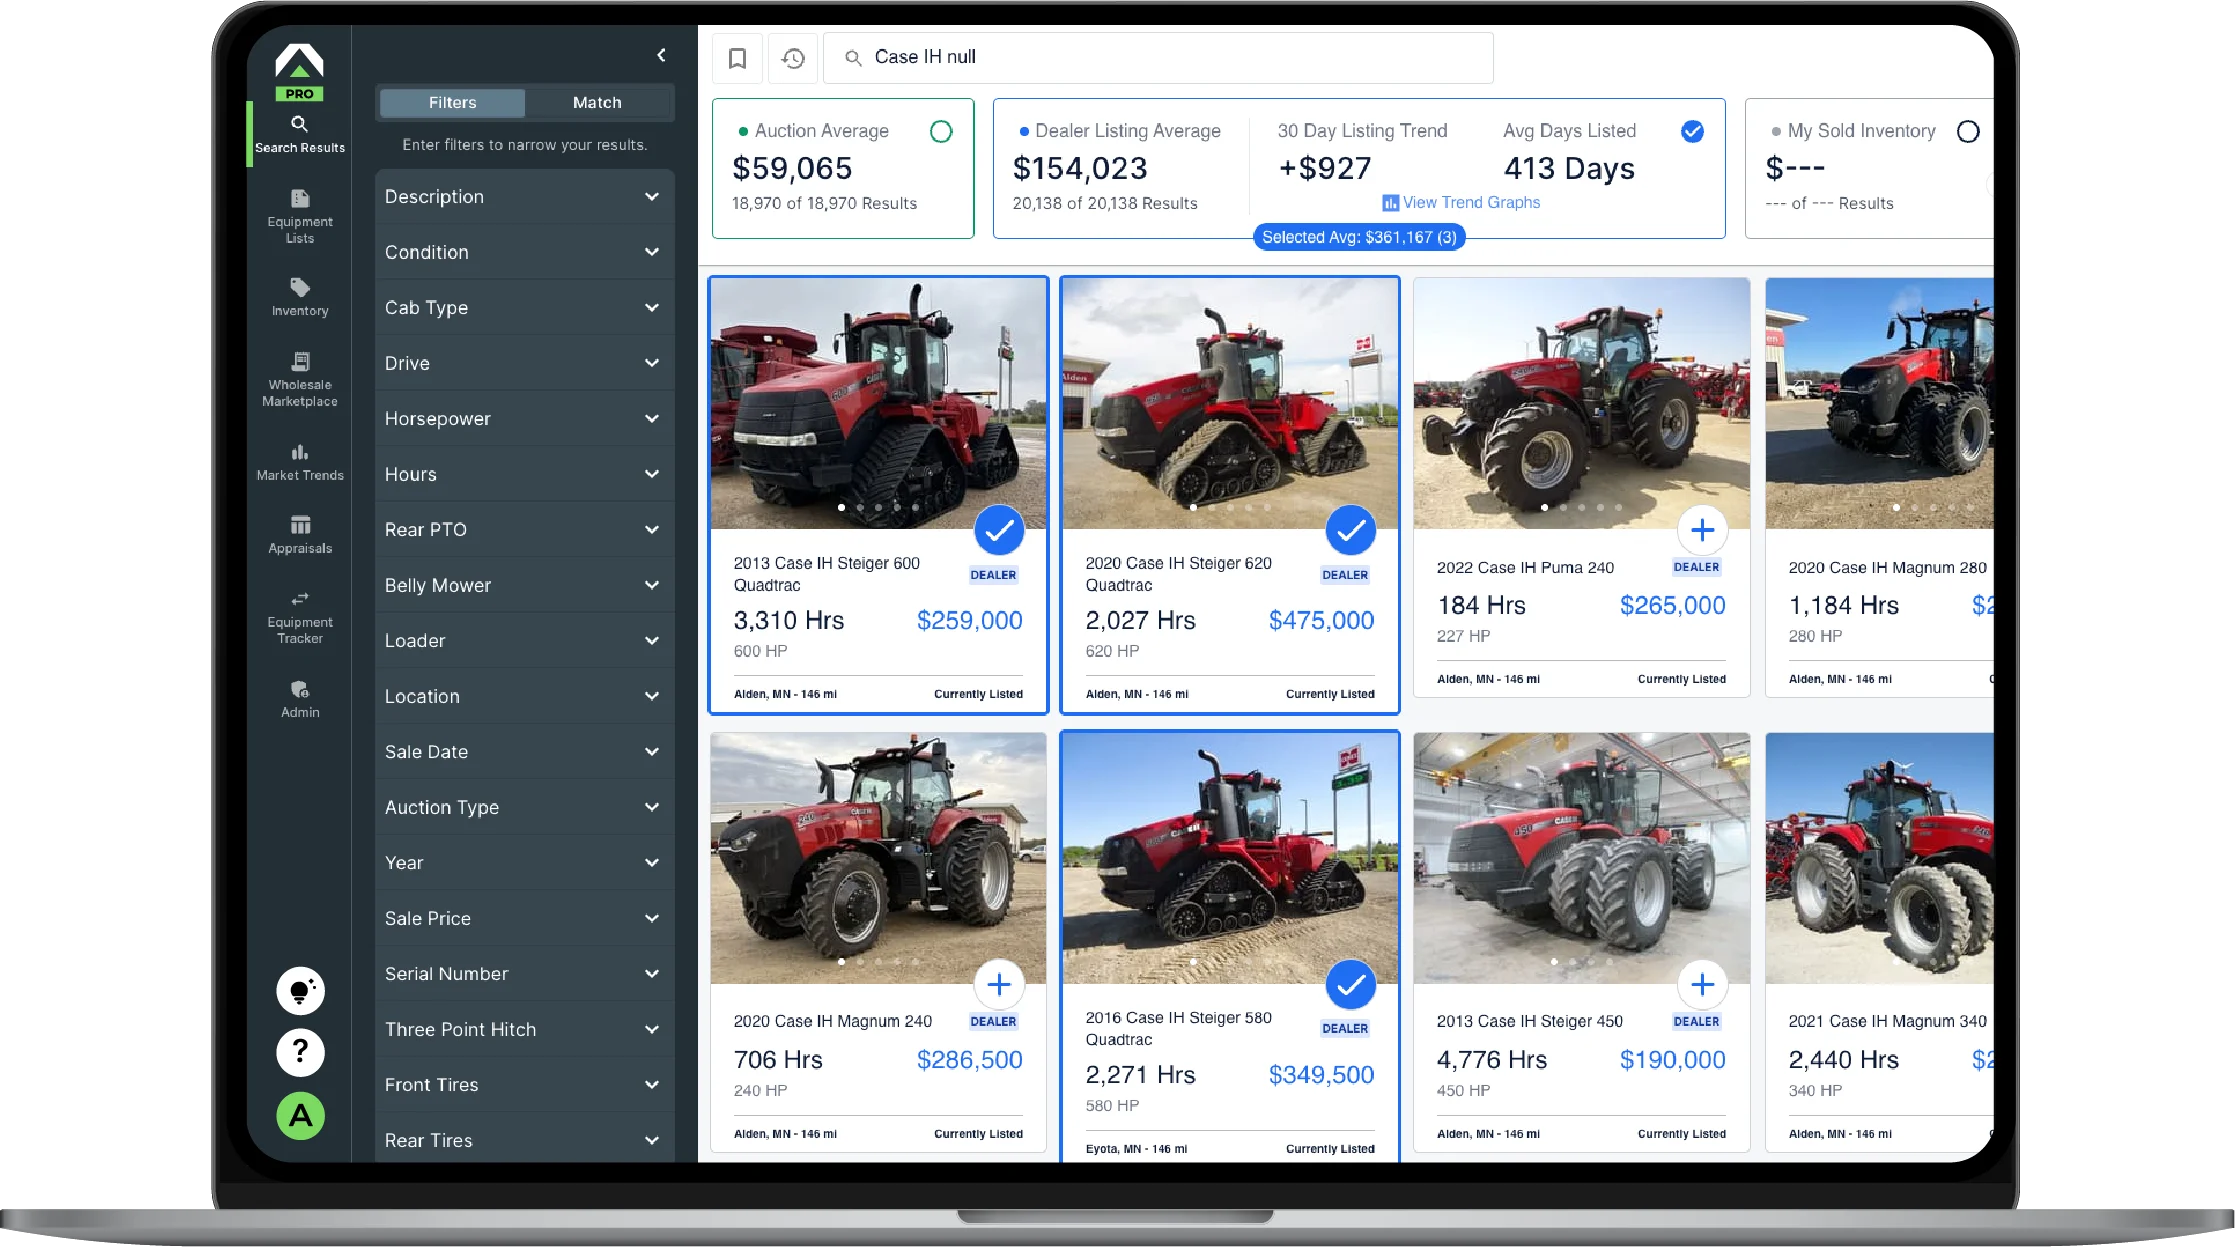
This report covers March 2026 used equipment market data across six key categories, tracking inventory volume, aged inventory, and turn rate trends. All metrics and data used in this report are sourced from Tractor Zoom Pro's equipment database, built on over $75B in real auction and dealer sales data.
Row crop tractor spotlight: Values are up, but velocity tells the real story
On the surface, row crop tractors are entering spring with an encouraging headline. Dealer supply for the 175–300 HP range is down roughly a quarter year over year, and larger 300–425 HP units are off about 14%. Auction values on low-hour machines have bounced back 13–18% compared to spring 2025, and retail asking prices are up around 12% on average, with late-model John Deere 8R280s climbing approximately 9% YoY.
But this is not 2021, and the velocity data underneath those numbers is the story dealers need to watch heading into Q2.
The hour-range split
Low-hour, late-model units are sitting significantly longer. Average days advertised have more than doubled since mid-2024, from around 122 days to roughly 300. Only about 14% of these units sell within the first 60 days, which is down from around 37% two years ago.
Meanwhile, higher-hour machines are telling the opposite story. Units in the 3,000–4,500 hour range are the fastest-moving segment in this category, and over half of that inventory in the 300–424 HP range sells within 60 days, the strongest sell-through rate for that bracket since mid-2025 and still improving month over month.
What's behind it
The drawdown in farm working capital over the past 12–18 months is showing up directly in purchasing behavior. The 2021–2022 boom pulled future purchases forward, and many "second-time buyers" are now satisfied and sitting out. This is a liquidity challenge, not a solvency crisis, but it's concentrating demand on mid-hour equipment that delivers productivity without the premium price tag, while also driving more eyeballs (and higher prices) to auctions.
Here’s where other categories are trending.
Row crop tractors (300–424 HP)
Inventory volume held essentially flat month over month, but the year-over-year contraction deepened to over 17%, an acceleration from last month's 14% YoY decline. While tighter supply should theoretically support pricing, the turn rate tells a different story, falling slightly from 1.4 to 1.2, down more than 11% MoM and over 18% YoY. Aged inventory continues to creep higher, up nearly 13% from a year ago and representing roughly a third of total active inventory.
- Inventory Volume: +1.4% MoM / -17.4% YoY
- Turn Rate: -11.4% MoM / -18.4% YoY
- Aged Inventory: +1.0% MoM / +12.8% YoY
4WD tractors (425+ HP)
The 4WD segment remains a challenged tractor category. Inventory edged down just over 2% MoM and declined nearly 14% year over year, indicating supply is finally drawing down more meaningfully. However, the turn rate fell to 0.92, down nearly 19% MoM and 18% YoY, marking the steepest monthly velocity drop in this report.
The aged inventory picture is perhaps the most concerning of any category, with a 45% increase in aged units (360+ days listed) from a year ago, currently representing over 42% of total active inventory. That's up from the already-elevated levels flagged last month.
- Inventory Volume: -2.4% MoM / -13.6% YoY
- Turn Rate: -18.6% MoM / -17.9% YoY
- Aged Inventory: +2.8% MoM / +45.3% YoY
Utility tractors (100–174 HP)
Utility tractors continue to stand apart as a resilient segment. Inventory volume was virtually unchanged MoM but is down nearly 29% year over year — the largest YoY inventory decline of any category in this report, extending the trend from last month's already-steep 24% drop. Notably, aged inventory improved at a nearly 5% MoM decline and an 8% YoY improvement, one of the few categories showing progress on aging. The turn rate cooled down nearly 20% MoM, but the broader demand picture remains constructive.
- Inventory Volume: +0.4% MoM / -28.6% YoY
- Turn Rate: -19.8% MoM / -7.0% YoY
- Aged Inventory: -4.6% MoM / -7.6% YoY

Combines (Class 7 & 8)
Combine inventory decreased about 1.4% MoM and over 10% YoY, a slightly steeper annual contraction than February’s 8.7%. Aged inventory held flat MoM, though the 14% YoY increase means roughly a third of active combine inventory has been listed for over a year.
The turn rate is the headline here, falling to 0.73, a nearly 27% MoM drop and by far the sharpest monthly velocity decline of any category. This pulls it decisively below the 1.0 threshold already flagged as a concern last month. With corn projected at around $4.10/bu and soybean meal demand steady but not surging, the commodity backdrop is stable enough to sustain needs-based replacement but not strong enough to drive aggressive purchasing.
- Inventory Volume: -1.4% MoM / -10.5% YoY
- Turn Rate: -26.9% MoM / -1.4% YoY
- Aged Inventory: -0.3% MoM / +13.9% YoY
Self-propelled sprayers
Sprayers remain a bright spot heading into spring. Inventory volume declined over 5% MoM and is down over 28% year over year, continuing the contraction seen in February. The turn rate held remarkably steady at 1.6, essentially flat MoM with a 5% YoY improvement. While last month's report highlighted sprayers as the only category where inventory was contracting and velocity was accelerating simultaneously, March data shows velocity has plateaued at a healthy level even as supply continues to tighten. Aged inventory also decreased nearly 5% MoM, though the 9% YoY increase indicates the legacy aging problem hasn't fully resolved.
- Inventory Volume: -5.1% MoM / -28.4% YoY
- Turn Rate: -0.6% MoM / +5.1% YoY
- Aged Inventory: -4.9% MoM / +8.8% YoY
Planters
Planter inventory continued its seasonal drawdown, falling over 5% MoM to 1,880 units and down nearly 36% year over year, the steepest YoY inventory decline of any category in this report. This is expected as planting season approaches and dealer lots thin out. Aged inventory improved meaningfully as well, suggesting that the seasonal demand pull is helping clear older units.
The turn rate eased to 1.8, off about 4% from last month but flat year over year. This is still the highest absolute turn rate of any category tracked, reflecting the urgency of planting-season demand. With corn and soybean acreage decisions largely locked in and commodity prices steady, this seasonal window is likely to sustain momentum through April before tapering.
- Inventory Volume: -5.3% MoM / -35.8% YoY
- Turn Rate: -3.8% MoM / Flat YoY
- Aged Inventory: -6.0% MoM / -17.2% YoY
Key takeaways for dealers heading into Q2
Velocity remains the defining challenge, not supply. Inventory is contracting year over year in every category, but turn rates declined MoM in all six segments. Tighter supply creates theoretical pricing leverage, but it only translates to margin if units are actually selling.
Aged inventory is a growing liability in key segments. 4WD tractors, combines, and sprayers all carry a significant share of inventory that has been listed for over a year. These units are tying up capital and depreciating. Proactive pricing action (or channel shifts to auction) could be something to consider before summer.
Sprayers and planters are the seasonal performers. These are the two categories where supply-demand dynamics most clearly favor dealers right now. Sprayer turn rates are relatively healthy and stable, while planters carry the highest absolute velocity in the report. Both benefit from the urgency of spring application and planting windows.
Commodity markets are stable but not stimulative. Corn at $4.10/bu, soybeans above $10.20, and a record Brazilian soybean crop mean equipment purchases will remain needs-based through at least the first half of 2026 and that inventory should be positioned accordingly.
Definitions & data sources
All equipment data and market trends presented in this report are sourced from Tractor Zoom Pro's dealer and auction marketplace database, which tracks equipment listings, transactions, and inventory activity across the U.S.
- Inventory Volume: The total number of equipment units actively listed for sale across the tracked dealer network at the time of reporting.
- Aged Inventory %: The percentage of active inventory that has been listed for 360 days or longer, indicating the share of inventory experiencing extended selling timelines.
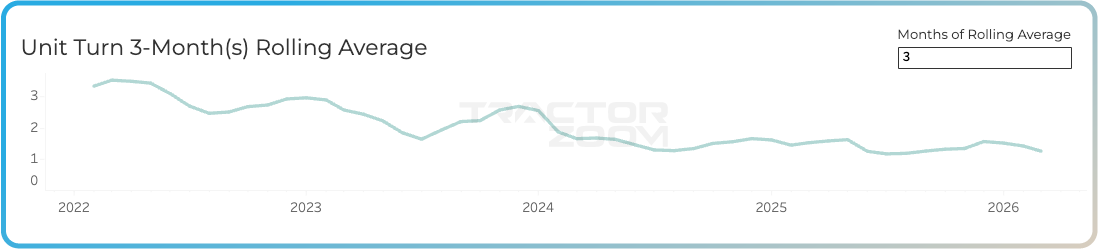
- Turn Rate: A measure of how quickly inventory is selling, calculated using a three-month rolling average of unit retail sales volume relative to available inventory. Higher turn rates indicate faster inventory movement and stronger market absorption.
Watch the April Market Insights Episode of Beyond the Hood, and visit our Podcast page for more equipment market trends and conversations with industry experts.
Make the market work for you
The market is shifting fast, and the dealers who stay ahead of it are the ones with access to the right data. Tractor Zoom Pro gives you real-time visibility into inventory trends, pricing benchmarks, and sales velocity across the used equipment market, so you can make smarter decisions on what to stock, how to price it, and when to move it.
Explore Tractor Zoom’s solutions and put your inventory strategy on firmer ground.

Join the future of ag & heavy equipment sales
Take a guided tour of Tractor Zoom Pro and Anvil Pro to discover how wider margins and faster turns are just a few clicks away.