

.webp)

Equipment Market Update: April 2026 Trends Across Categories

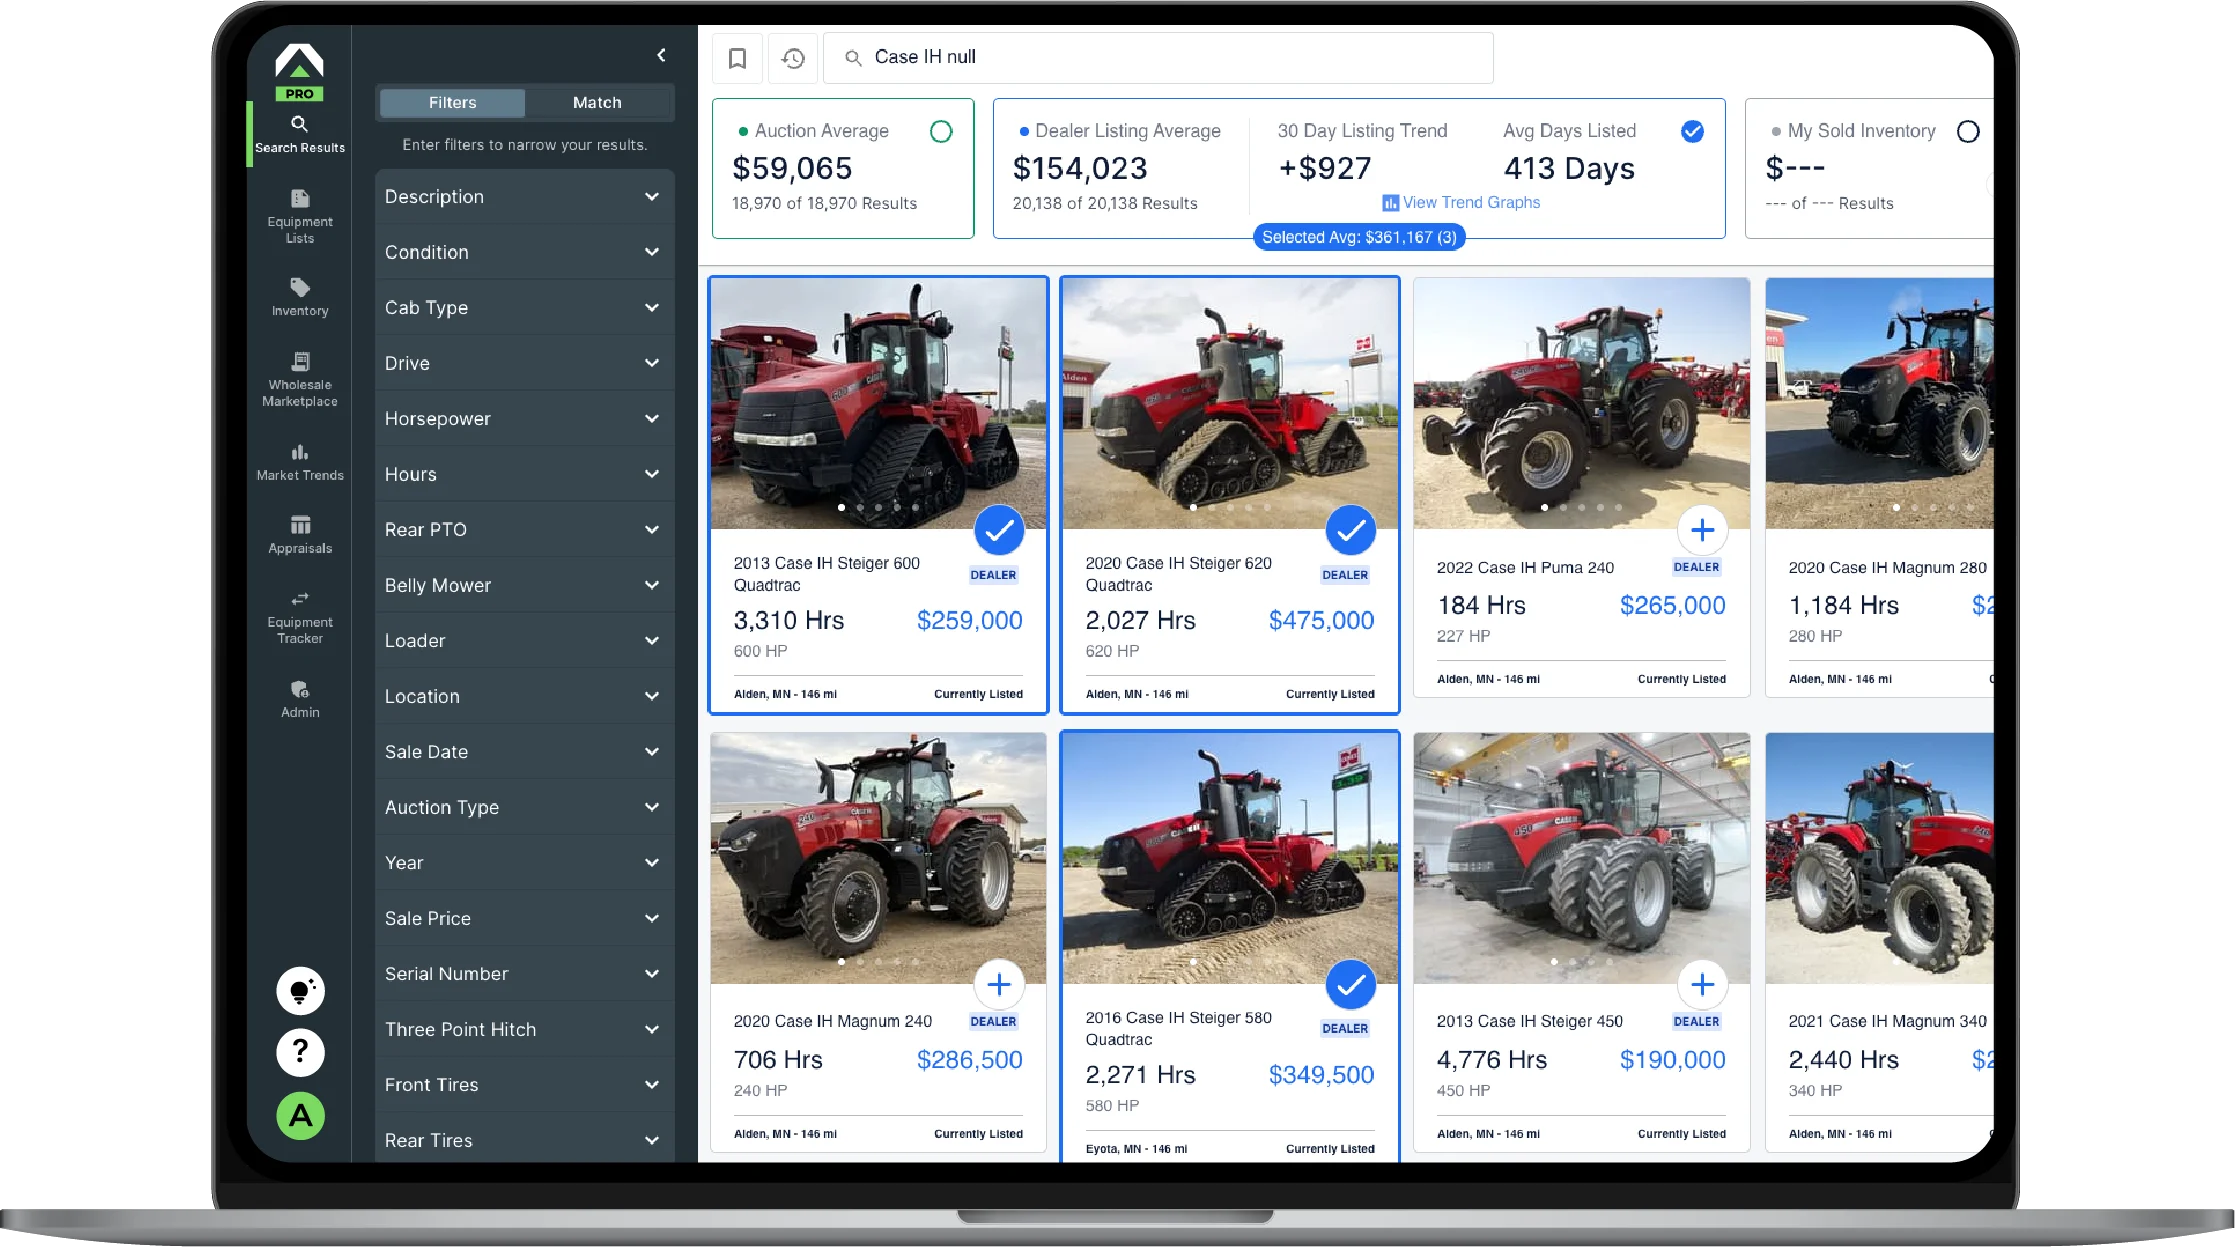
This report covers April 2026 used equipment market data across six key categories, tracking inventory volume, aged inventory, turn rate, and 60-day velocity trends. All metrics and data used in this report are sourced from Tractor Zoom Pro's equipment database, built on over $75B in real auction and dealer sales data.
Equipment spotlight: What grain cart movement tells us about the broader market
Grain carts aren't typically the biggest concern for dealerships, but a trend developing in this category may signal what's coming for other implement lines. Andy Campbell, Tractor Zoom's Director of Insights, recently broke down why this overlooked segment deserves attention in the latest Farm-Equipment.com publication.
Overall equipment inventory is down roughly 30% from its late-summer 2024 peak, which is an encouraging headline. But underneath, conditions have shifted. Commodity prices remain low, tariffs have pushed up new machinery costs, and auction values for most categories dropped last year. That widening gap between new equipment pricing and used market reality is hitting grain carts especially hard.
- Average days listed for grain carts on dealer lots has climbed from just over 300 days to nearly 400 in the span of a single year.
- This past December (historically the second-strongest sales month for carts), retail unit sales came in at just 60% of the prior year's volume.
- Retail asking prices for 900–1,100 bushel carts have jumped approximately 13% YoY in 2026, pushing more buyers to the sidelines.

Why carts are stalling, and why it matters beyond carts
Grain carts are highly elastic purchases. They're deferrable, they last a long time with few wear parts, and buyers who upgraded during the 2021–2023 profit boom aren't coming back anytime soon. When cash flow tightens, these are the first purchases to get pushed off. The conditions driving that behavior (including constrained farm liquidity, elevated new pricing, and extended replacement cycles) aren't unique to carts.
Tillage equipment shares many of the same traits, such as long useful life, deferrable replacement, limited brand differentiation. Class 7 combines and smaller row crop tractors share some of the same early indicators as grain carts too.
What this means for dealers
With August as the peak selling month for carts, the window to act is narrow and the setup heading into summer is not favorable. The same logic applies more broadly: Identify likely buyers now, stress-test pricing against current market reality, and move inventory before carrying costs compound. The data is sending a signal, and the question is whether we act on it early enough.
Read Andy Campbell’s full analysis of grain cart movement, and what other categories are at high risk on the Farm Equipment website.
Row crop tractors (300–424 HP)
Row crop inventory continued to contract in April, with supply now down over 15% from a year ago. The turn rate held nearly flat month over month, a welcome stabilization after March's sharper decline. But it remains well below year-ago levels. The encouraging story is aging, with the aged share of inventory dropping to around 31% of total active supply. But 60-day velocity remains a concern; stale stock is clearing, but fresh demand is selective and concentrated on competitively priced mid-hour units.
- Inventory Volume: -3.7% MoM / -15.3% YoY
- Turn Rate: -1.6% MoM / -22.8% YoY
- Aged Inventory: -9.2% MoM / +8.5% YoY
- 60-Day Velocity: -7.0% MoM / -47.8% YoY

4WD tractors (425+ HP)
The 4WD segment showed cautiously improved signals in April. The turn rate posted its first positive MoM move in several months, and aged inventory drew down a percentage or so, though it still sits roughly 30% above April 2025 levels. The 60-day velocity improvement was the strongest of any category on a monthly basis, but the year-over-year gap remains steep and the aged overhang means this category still warrants cautious positioning.
- Inventory Volume: -1.4% MoM / -11.5% YoY
- Turn Rate: +5.3% MoM / -16.7% YoY
- Aged Inventory: -9.7% MoM / +30.1% YoY
- 60-Day Velocity: +17.1% MoM / -46.1% YoY
Utility tractors (100–174 HP)
Utility tractors maintain a trend of decreasing supply, posting the largest year-over-year inventory volume decline of any category for the second consecutive month. Aged inventory improved sharply on both a monthly and annual basis, making this the only segment where the aging problem is clearly resolving. This category also continues to post a high number of units sold within two months, supported by diversified demand from livestock and hobby farm buyers.
- Inventory Volume: -0.7% MoM / -29.9% YoY
- Turn Rate: -7.7% MoM / -6.5% YoY
- Aged Inventory: -12.2% MoM / -15.7% YoY
- 60-Day Velocity: -2.5% MoM / -43.6% YoY

Combines (Class 7 & 8)
Combine supply continued its gradual drawdown in April, with the turn rate remaining below 1.0 for the third consecutive month. The YoY turn rate comparison is slightly positive, however, suggesting this segment may be finding a floor. Aged inventory saw one of the largest monthly improvements across categories, while 60-day velocity posted a significant decline from April 2025. Combines remain firmly in needs-based purchase territory.
- Inventory Volume: -3.2% MoM / -10.1% YoY
- Turn Rate: -5.4% MoM / +2.9% YoY
- Aged Inventory: -12.7% MoM / +1.4% YoY
- 60-Day Velocity: -17.1% MoM / -31.0% YoY
Self-propelled sprayers
Sprayers continued to perform relatively well in April, with the turn rate climbing on both a monthly and annual basis, making this the only category with positive movement on both timeframes. Aged inventory improved at a double-digit monthly pace. The 60-day velocity reading pulled back from March, but this likely reflects the natural cadence of spring application as many buyers secured machines in the first two months of Q1.
- Inventory Volume: -3.9% MoM / -23.9% YoY
- Turn Rate: +6.3% MoM / +6.3% YoY
- Aged Inventory: -12.0% MoM / +1.3% YoY
- 60-Day Velocity: -27.9% MoM / -34.4% YoY

Planters
Planter inventory drew down sharply in April, posting both the steepest monthly and year-over-year inventory declines in the report as peak planting demand pulled units off lots. Aged inventory fell significantly on both timeframes, confirming the seasonal surge is clearing older stock alongside fresh listings. The turn rate and 60-day velocity both eased from March, consistent with the tail end of the spring buying window. But dealers with remaining stock should position aggressively now, as demand will taper into summer.
- Inventory Volume: -10.8% MoM / -34.6% YoY
- Turn Rate: -10.5% MoM / -5.6% YoY
- Aged Inventory: -17.6% MoM / -22.5% YoY
- 60-Day Velocity: -21.2% MoM / -38.1% YoY
The takeaway for dealers in early May
60-day velocity tells the sharpest story. While inventory positions are improving, our 60-day velocity metric makes the YoY slowdown impossible to ignore: Every major category is selling 30–48% fewer units within 60 days compared to a year ago.
Even in segments where turn rates look reasonable, the absolute number of fast-moving units has contracted significantly. This reinforces the importance of a strong sales system (including pre-selling and accurate trade evaluations), so pricing is on target on day one.
Definitions & data sources
All equipment data and market trends presented in this report are sourced from Tractor Zoom Pro's dealer and auction marketplace database, which tracks equipment listings, transactions, and inventory activity across the U.S.
- Inventory Volume: The total number of equipment units actively listed for sale across the tracked dealer network at the time of reporting.
- Aged Inventory %: The percentage of active inventory that has been listed for 360 days or longer, indicating the share of inventory experiencing extended selling timelines.
- Turn Rate: A measure of how quickly inventory is selling, calculated using a three-month rolling average of unit retail sales volume relative to available inventory. Higher turn rates indicate faster inventory movement and stronger market absorption.
- 60-Day Velocity: The number of units in a given category that sold within 60 days or fewer of their initial listing date during the reporting month. Higher numbers indicate stronger early demand and healthier sell-through.
Make the market work for you
The market is shifting fast, and the dealers who stay ahead of it are the ones with the right data in hand. Tractor Zoom Pro gives you real-time visibility into inventory trends, pricing benchmarks, and sales velocity across the used equipment market, so you can make smarter decisions on what to stock, how to price it, and when to move it. Explore Tractor Zoom Pro and put your inventory strategy on firmer ground.

Join the future of ag & heavy equipment sales
Take a guided tour of Tractor Zoom Pro and Anvil Pro to discover how wider margins and faster turns are just a few clicks away.