.webp)

Equipment Market Insights: January Trends Across Tractors, Combines, & Sprayers
.webp)
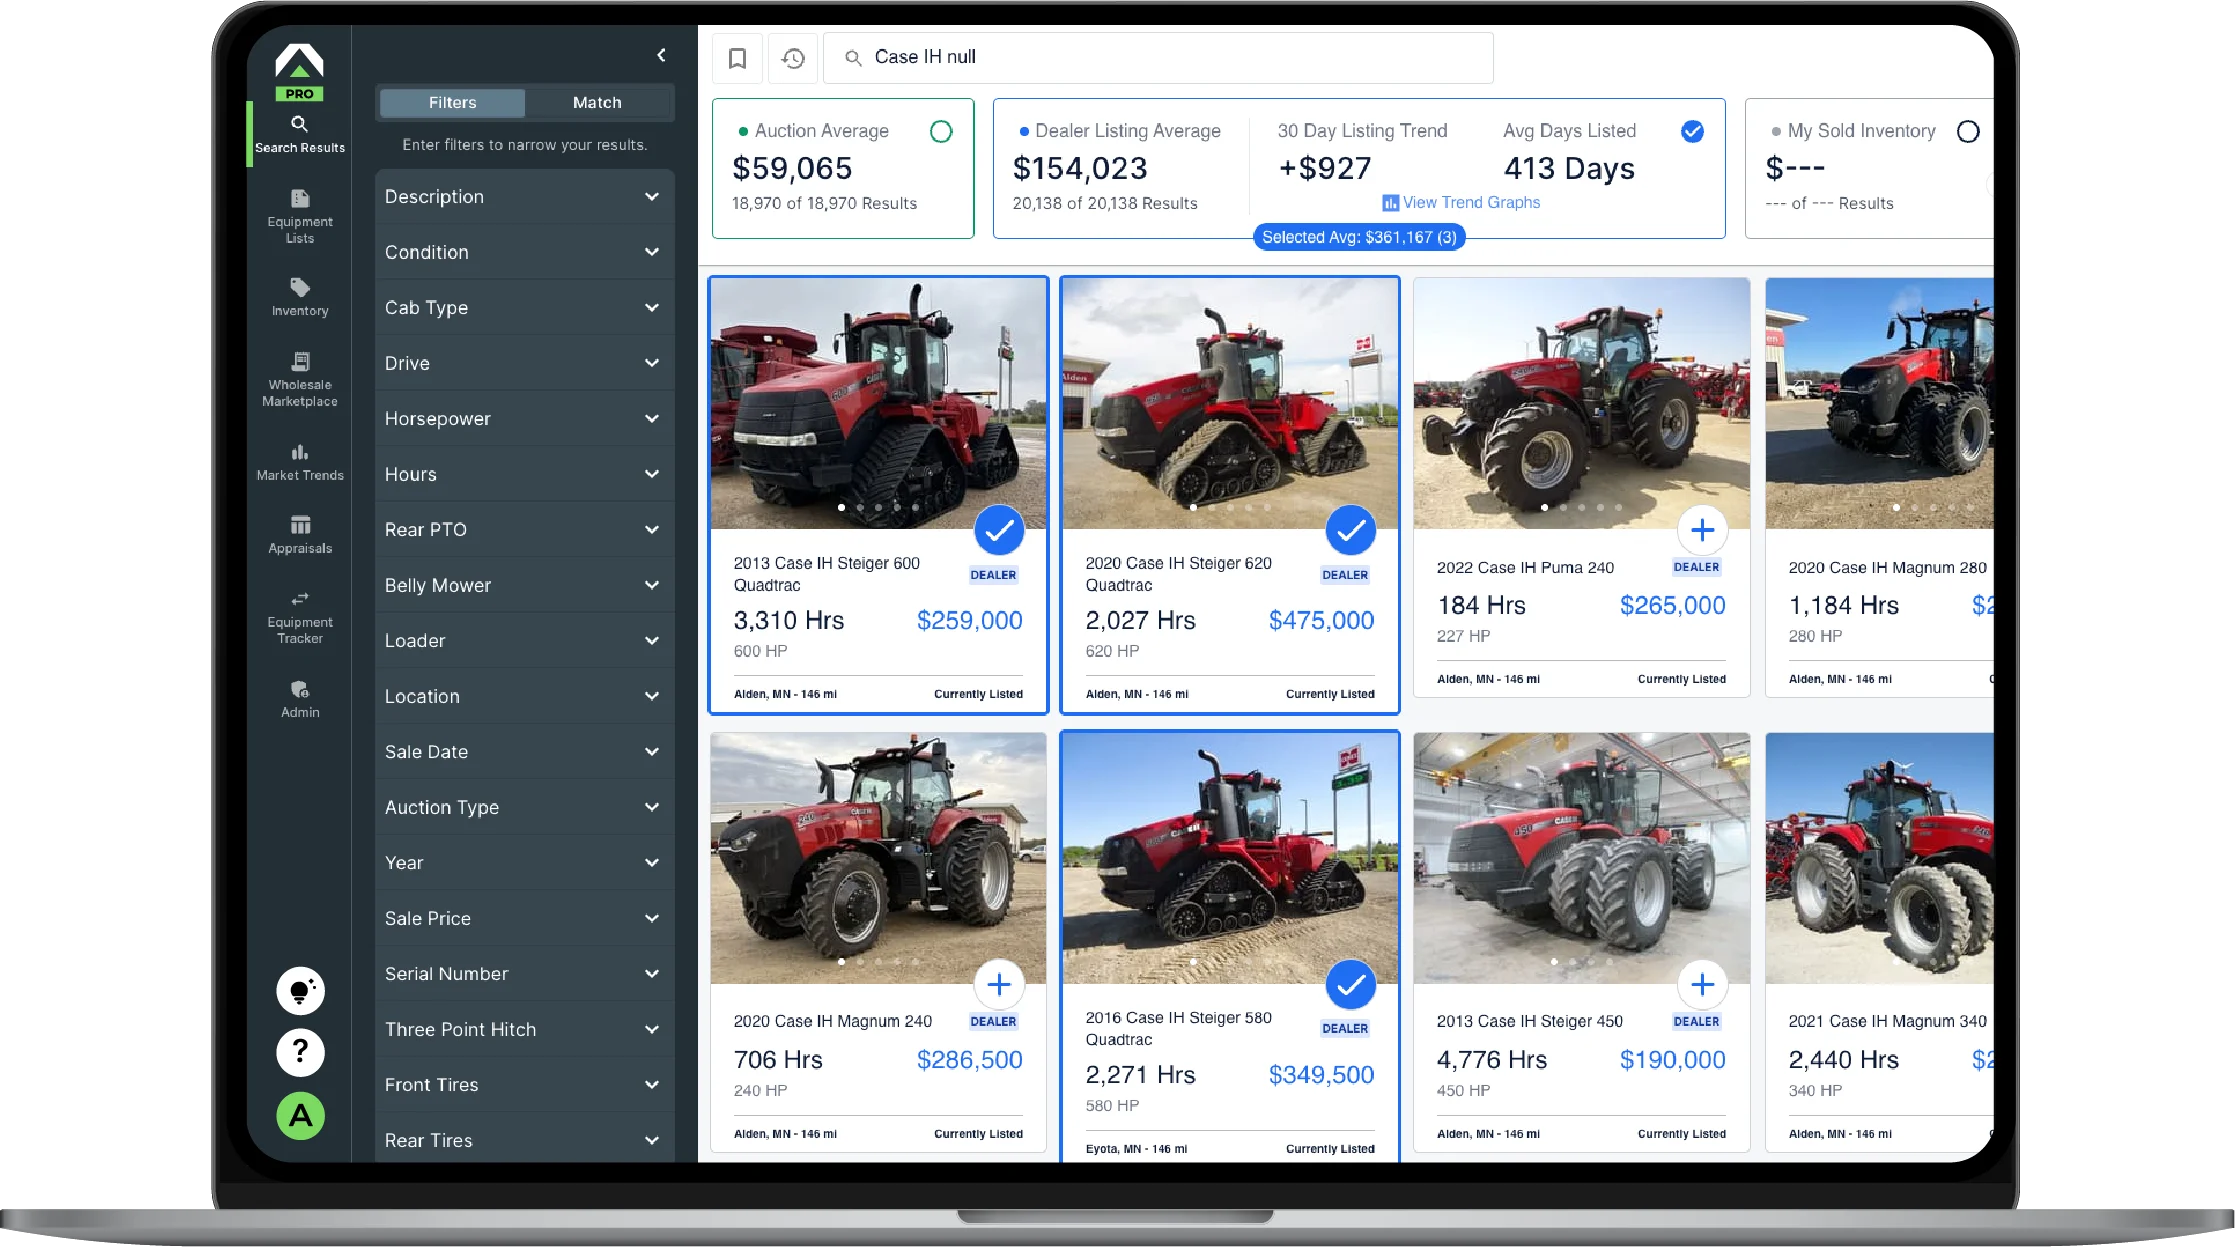
This report covers January 2026 used equipment market data across five key categories, tracking inventory volume, aged inventory, and turn rate trends. All metrics and data used in this report are sourced from Tractor Zoom Pro's equipment database, built on over $75B in real auction and dealer sales data.
Tractor market analysis: Supply tightening lifts auction values despite soft demand
The broader agricultural economy isn't offering many reasons for optimism right now. Commodity prices are essentially flat, Brazil is producing a strong soybean crop, and while China has signaled interest in purchasing more U.S. soybeans, no formal agreement is in place, leaving demand fundamentals largely uncertain. Yet despite that muted backdrop, tractor values are telling a different story at auction.
Row crop tractor auction values rose 7% year over year in the first two months of 2026 for low-hour, high-horsepower units (those under 2,000 hours), with smaller row crop tractors also showing gains, though less pronounced.
What's driving this trend? Supply. Dealers have been actively reducing inventory for nearly two years, and farmers have been reluctant to purchase new equipment – both trends that have drawn overall supply down significantly. Row crop tractor inventory alone is down 15% year over year. Government payments and farm subsidies may also be playing an outsized role in supporting buyer sentiment, even when commodity prices don't justify it on their own.
March will be the next real test, as it’s the leading indicator for first-half-of-year auction activity. By late March, the market will have a much clearer picture of where equipment values are truly headed in 2026. The category data below reflects where things stand heading into that critical window.
Row crop tractors (300–424 HP)
In January, row crop tractor supply continued to decrease, with inventory volume down 4.13% month over month and 14.74% year over year. Even with fewer units available, equipment is not turning faster. The aged inventory amount on dealer lots (about 360 days) decreased slightly to 30.5%, meaning more machines are sitting on lots longer than a year ago, but that has decreased a few points in early 2026. At the same time, the turn rate declined to 1.49, showing slower sales activity compared to last year, despite the lower overall inventory.
Inventory Volume: -4.13% MoM / -14.74% YoY
Turn Rate: -2.6% MoM / -7.5% YoY
Aged Inventory: -4.2% MoM / +26.6% YoY
4WD tractors (425+ HP)
The 4WD tractor category remains under slight pressure. Inventory volume did drop 1.35% MoM and 9.54% YoY, but aging inventory continues to grow. The aged inventory amount reached ~40%, with a very slight decrease from December. Meanwhile, the turn rate fell to 1.3, indicating slower retail demand. For dealers, this suggests high-horsepower units may require more frequent pricing reviews moving forward.
Inventory Volume: -1.35% MoM / -9.54% YoY
Turn Rate: -4.7% MoM / -8.4% YoY
Aged Inventory: -1.72% MoM / +65.3% YoY
Utility tractors (100–174 HP)
Utility tractors continue to show stronger fundamentals than large ag equipment categories. Inventory volume declined 1.71% MoM and 26.59% YoY, reflecting significantly tighter supply compared to last year. However, aging inventory is gradually increasing, with aged inventory reaching 27.47%. The unit turn rate remained elevated at around 2.0, an 11% increase over this time last year, showing that demand is still relatively healthy. This segment continues to move better than most, though dealers should monitor aging units closely.
Inventory Volume: -1.71% MoM / -26.59% YoY
Turn Rate: -3.2% MoM / +11% YoY
Aged Inventory: -2.5% MoM / +5.2% YoY
Inventory volume for utility tractors has decreased significantly from a year ago, while turn rate has seen a measurable increase.
Combines (Class 7 & 8)
Combine inventory held mostly steady in January, with inventory volume nearly flat. However, more machines are aging on dealer lots, as the aged inventory volume rose to 36.5% of total inventory. The turn rate dropped to 1.3 , suggesting sales slowed following recent seasonal movement, even though performance remains similar to last year. Dealers may continue to face longer selling cycles until demand strengthens later in the year.
Inventory Volume: -.29% [Flat] MoM / -11.49% YoY
Turn Rate: -16.9% MoM / +0.7% [Flat] YoY
Aged Inventory: -5.0% MoM / +16.2% YoY
Self-propelled sprayers
The sprayer market showed mixed results in January. Inventory volume fell 3.25% MoM and 19.73% YoY, pointing to reduced overall supply. At the same time, aging inventory increased sharply, with aged inventory rising to 40.1%. Despite this, the turn rate improved to 1.5, indicating recent sales activity has picked up. This suggests newer or competitively priced units are selling, while older inventory continues to lag behind.
Inventory Volume: -3.25 MoM / -19.73 YoY
Turn Rate: +15.85% MoM / +2.0% YoY
Aged Inventory: -8.6% MoM / +39.4% YoY
While aged inventory continues to be a problem for self-propelled sprayers (and most other categories), total aged units have seen a near-10% decrease since December.
Key takeaways for dealers
Falling inventory doesn't automatically mean faster sales—and January proves it. Inventory is contracting across every category, yet turn rates are declining in most of them. Supply tightening creates pricing leverage, not passive sales momentum. Here's what to act on:
Auction values are rising, make sure your retail pricing reflects it. Row crop tractor auction values are up 7% YoY for low-hour, high-horsepower units. If your retail prices haven't moved, you're likely leaving margin on the table.
Aged inventory is your real exposure. 4WD tractors and sprayers both sit at ~40% aged inventory. Those are units tying up capital and depreciating. A proactive pricing strategy on stale units frees you up to acquire the fresh inventory that actually turns.
Utility tractors are outperforming, but watch the trend. With a turn rate 11% above last year and inventory down nearly 27% YoY, this segment leads the market. Aged inventory is starting to creep up, though, so don't get complacent.
March is the market's next signal. It's the bellwether for first-half auction activity. Watch whether buyer sentiment holds, and price and acquire accordingly.
Definitions & data sources
All equipment data and market trends presented in this report are sourced from Tractor Zoom Pro’s dealer and auction marketplace database, which tracks equipment listings, transactions, and inventory activity across the US..
Inventory Volume: The total number of equipment units actively listed for sale across the tracked dealer network at the time of reporting.
Aged Inventory %: The percentage of active inventory that has been listed for 360 days or longer, indicating the share of inventory experiencing extended selling timelines.
Turn Rate: A measure of how quickly inventory is selling, calculated using a three-month rolling average of UNIT retail sales volume relative to available inventory, not machinery sale price and cost as the financial turns metric is calculated, although both will trend togetherHigher turn rates indicate faster inventory movement and stronger market absorption.
Make the market work for you
The market is shifting fast, and the dealers who stay ahead of it are the ones with the right data in hand. Tractor Zoom Pro gives you real-time visibility into inventory trends, pricing benchmarks, and sales velocity across the used equipment market so you can make smarter decisions on what to stock, how to price it, and when to move it. Explore Tractor Zoom Pro and put your inventory strategy on firmer ground.

Join the future of ag & heavy equipment sales
Take a guided tour of Tractor Zoom Pro and Anvil Pro to discover how wider margins and faster turns are just a few clicks away.