.webp)

From Insights to Action: How and Why to Use Tractor Zoom Pro for Equipment Supply & Demand Analysis

If you're navigating the used equipment market, access to accurate and comprehensive data is crucial. For both financial institutions and equipment dealers, understanding the supply and demand dynamics of the equipment market is essential for strategic decision-making. Financial institutions can better assess collateral value and portfolio risk, while dealers can make informed choices on trade-in values, pricing, and inventory management to stay competitive and avoid long-term inventory issues.Tractor Zoom Pro is built to provide just that — aggregating data from over 65% of the U.S. auction and dealer market for farm and heavy machinery. This makes it a powerful resource to leverage for comparables on all types of equipment.
Below, we’ll demonstrate how to make the most of Tractor Zoom Pro Equipment Comps & Values to unlock key insights into equipment supply and demand, with guidance from our Director of Insights, Andy Campbell.
Equipment Supply & Demand Data in Tractor Zoom Pro
Steps to Access Supply & Demand Insights
Follow these steps to find the data you need in Search Results, and view the video above to follow along.
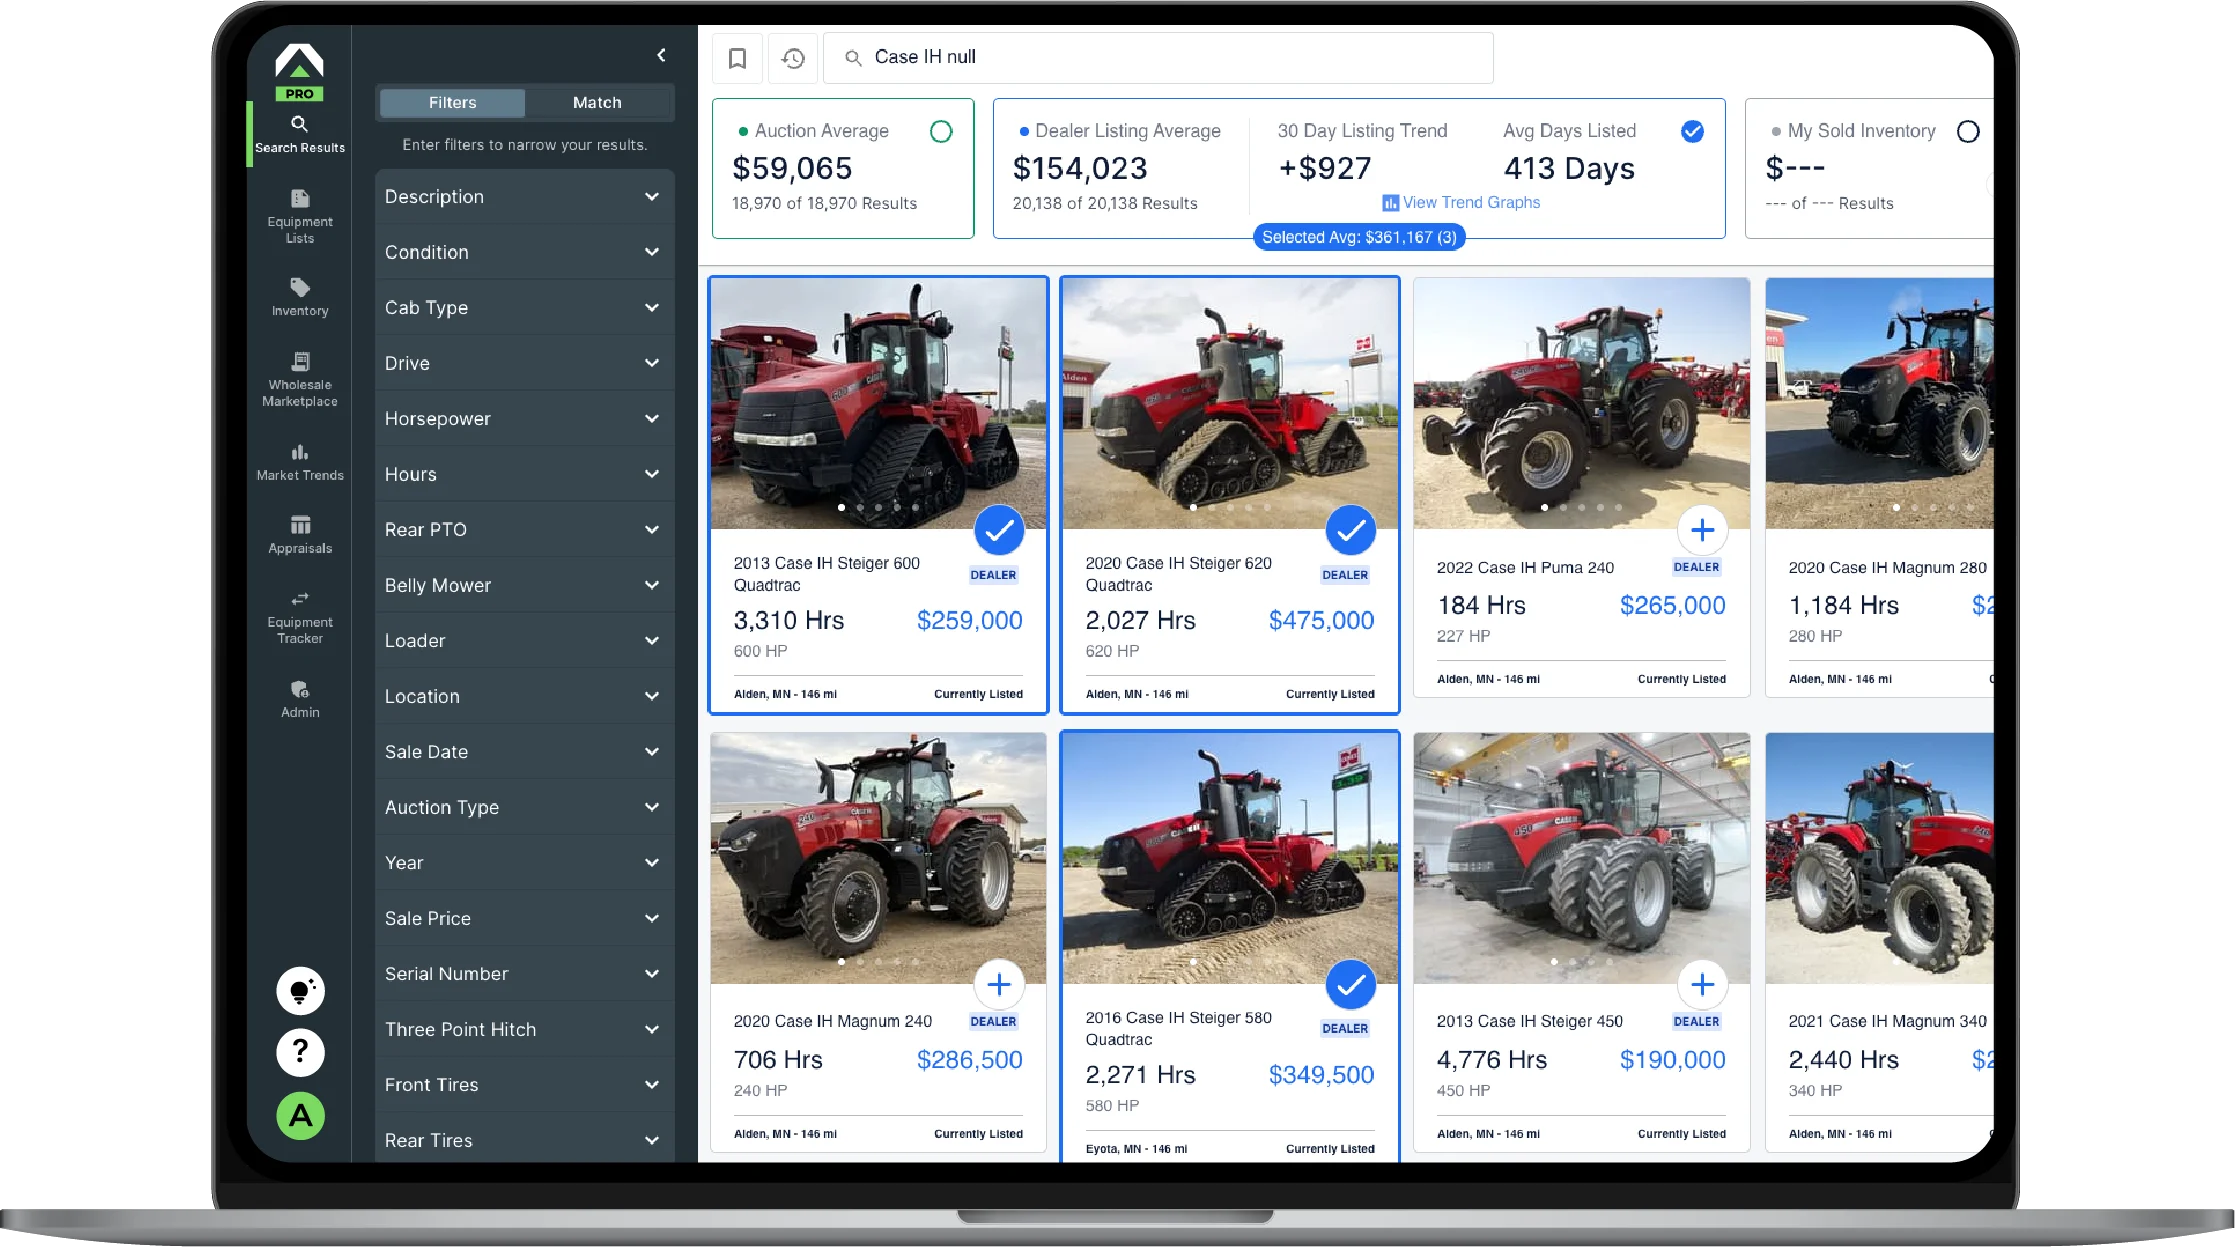
Step 1: Log in to Tractor Zoom Pro
To get started, log in to Tractor Zoom Pro. Once you're in, you’ll have immediate access to a variety of search and filtering options designed to streamline your equipment research process.
Step 2: Start a search
To find specific equipment, enter the make and model in the search bar. For example, if you're looking for a John Deere 8345R, simply type it in, and Tractor Zoom Pro will pull up relevant listings.
The autocomplete feature in Search will populate the results quickly, but you can also complete your search by specifying Make & Model, Category, or Match methods.
Find comparables with efficiency and further filter results by condition, sale date, hours used, and more.
Step 3: View Trend Graphs
One of the lesser-known yet highly valuable representations of data are the Trend Graphs, which you can access in the Dealer Listing Averages section below the search bar. Select this section and click View Trend Graphs.
Here you will find visual data trends specific to the make and model you searched for. We recommend adjusting the time period to that of two years to better spot shifts in the market, such as price movement or an influx of specific equipment types. Keeping an eye on these trends can guide your buying and selling strategies.
In addition, you can utilize the Supply & Demand chart to estimate the industry’s monthly unit turn rate. Simply divide the total sold by the number advertised to get your monthly number. Multiply that by 12 to get your annual estimated turn rate, a critical metric for gauging the industry’s inventory movement.
With Tractor Zoom Pro, identifying equipment demand, market saturation, and pricing trends is a straightforward process. Leveraging these data-driven insights not only gives you a competitive edge with real-time, quality-assured data, but also saves time and provides you with the resources to make better decisions. We’re dedicated to helping you navigate the used equipment landscape confidently.

Join the future of ag & heavy equipment sales
Take a guided tour of Tractor Zoom Pro and Anvil Pro to discover how wider margins and faster turns are just a few clicks away.